Budget Questions I Would Ask
I will creating a series of blog posts related to the upcoming 2026 budget for the Municipality of North Cowichan.
The purpose of these posts will be to provide insight on my thought processes and also hopefully provide some guidance to others on useful questions to raise when considering the current state of our municipal budget and the ongoing dance between staff and Council as they attempt to nail down 2026 priorities and requirements.
The place to start is by reviewing the Connect North Cowichan page for the 2026 budget. It is available here:
https://www.connectnorthcowichan.ca/
As context to this information, I find it interesting to refer back to the documentation provided to the public regarding the 2025 budget process which it still available from the Meeting Agendas for public “consultations” that occurred in Duncan, Crofton and Chemainus in late November and Early December 2024:
https://pub-northcowichan.escribemeetings.com/FileStream.ashx?DocumentId=17837
This 60 page document includes what were described as a series of Business Plans for the 16 service units of North Cowichan. It proposed a $75.8 million dollar operating budget and provided no apparent specifics for an anticipated Capital Budget.
Looking specifically to 2026, I see that Council were presented with a Nov report from staff that provided them with a seemingly random list of options to reduce costs while maintaining obligations.
I also note that the Connect North Cowichan page includes some effort to contextualize North Cowichan tax rates by comparing their “per capita” rates with other municipalities of a similar population as well as “relative tax rates based on a house assessed at less than average rates”? Whatever does that mean I wonder?
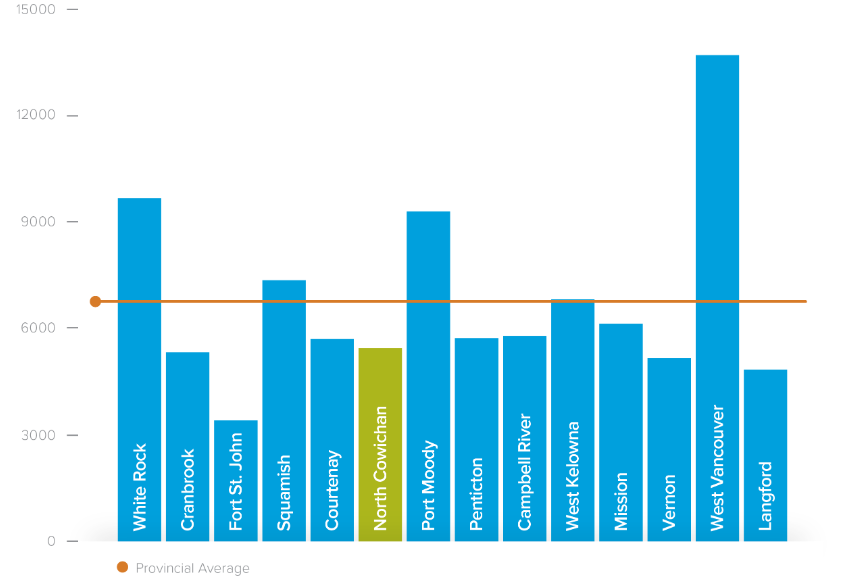
I am honestly not sure what staff are trying to communicate here, other than to presumably suggest that North Cowichan could collect more $ in taxes because they seem to be collecting less than other municipalities?
Next is the per capita example:
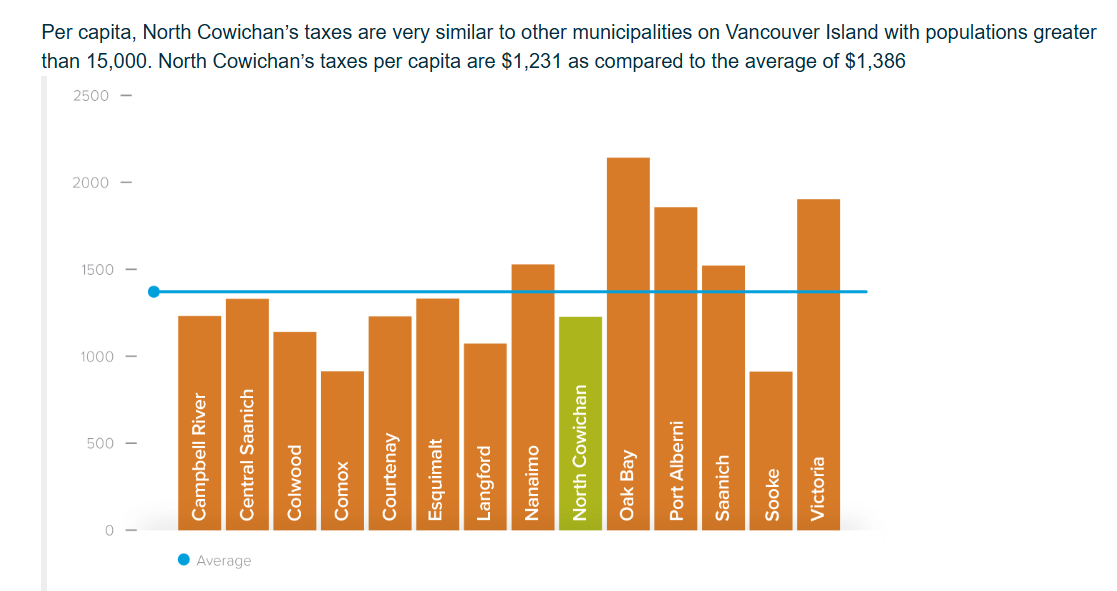
Again, the only takeaway I see for the casual reader, is that North Cowichan needs to collect more taxes!!
So why do I find this problematic?
A monetary value devoid of context, is a useless value.
According to the Municipality’s own website:
“North Cowichan was incorporated on June 18, 1873, and is the fifth oldest municipality in B.C. In 1912, the “big city” part of the municipality voted to secede from the rural part, which resulted in the creation of the City of Duncan. In 2023, North Cowichan celebrated its 150th anniversary.
North Cowichan spans 195 square kilometers, with 40 kilometres of oceanfront along the east side of Vancouver Island….”
Which is just to say, North Cowichan has a large property base and it also has aged infrastructure base because of the age of the municipality which means that our future asset replacement obligations are likely significantly higher than what is projected for municipalities like Esquimalt and Oak Bay as examples.
I’ll also note that data easily available from Civic Info BC can be used to provide some immediately relevant context to the tables above. For instance, here are some examples starting with some relevant factors for consideration:
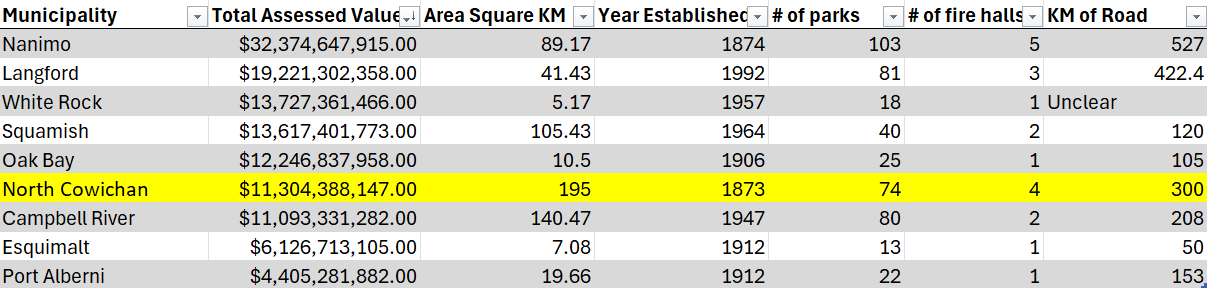
Here is a brief table I created using data available from Civic Info
I also found it interesting to assess general municipal taxes collected, against parcel taxes, as well as user fees and in doing so I noticed a new level of variety that is not provided in the municipal data provided to Mayor and Council for consideration. Namely, only some municipalities collect parcel tax and there also seems to be significant variety in user fees collected. Please see below.
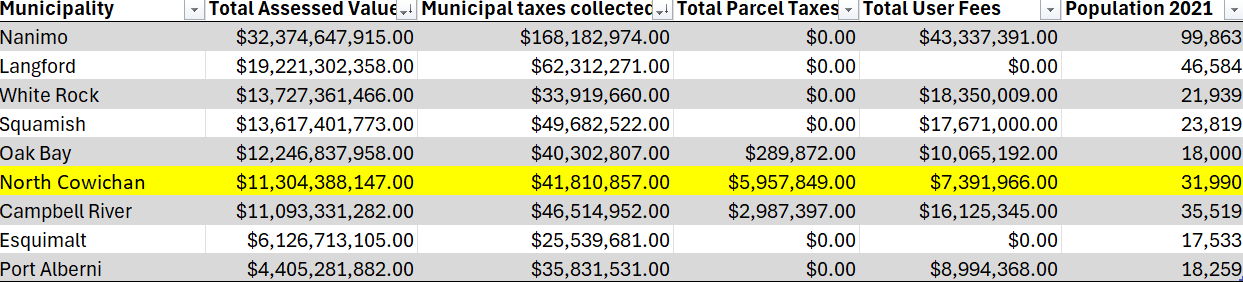
Here is a comparative table with some additional variables for consideration
Based on this additional data from Civic info I have updated the comparative bar charts provided by the municipality to show a broader picture of what is potentially being considered:
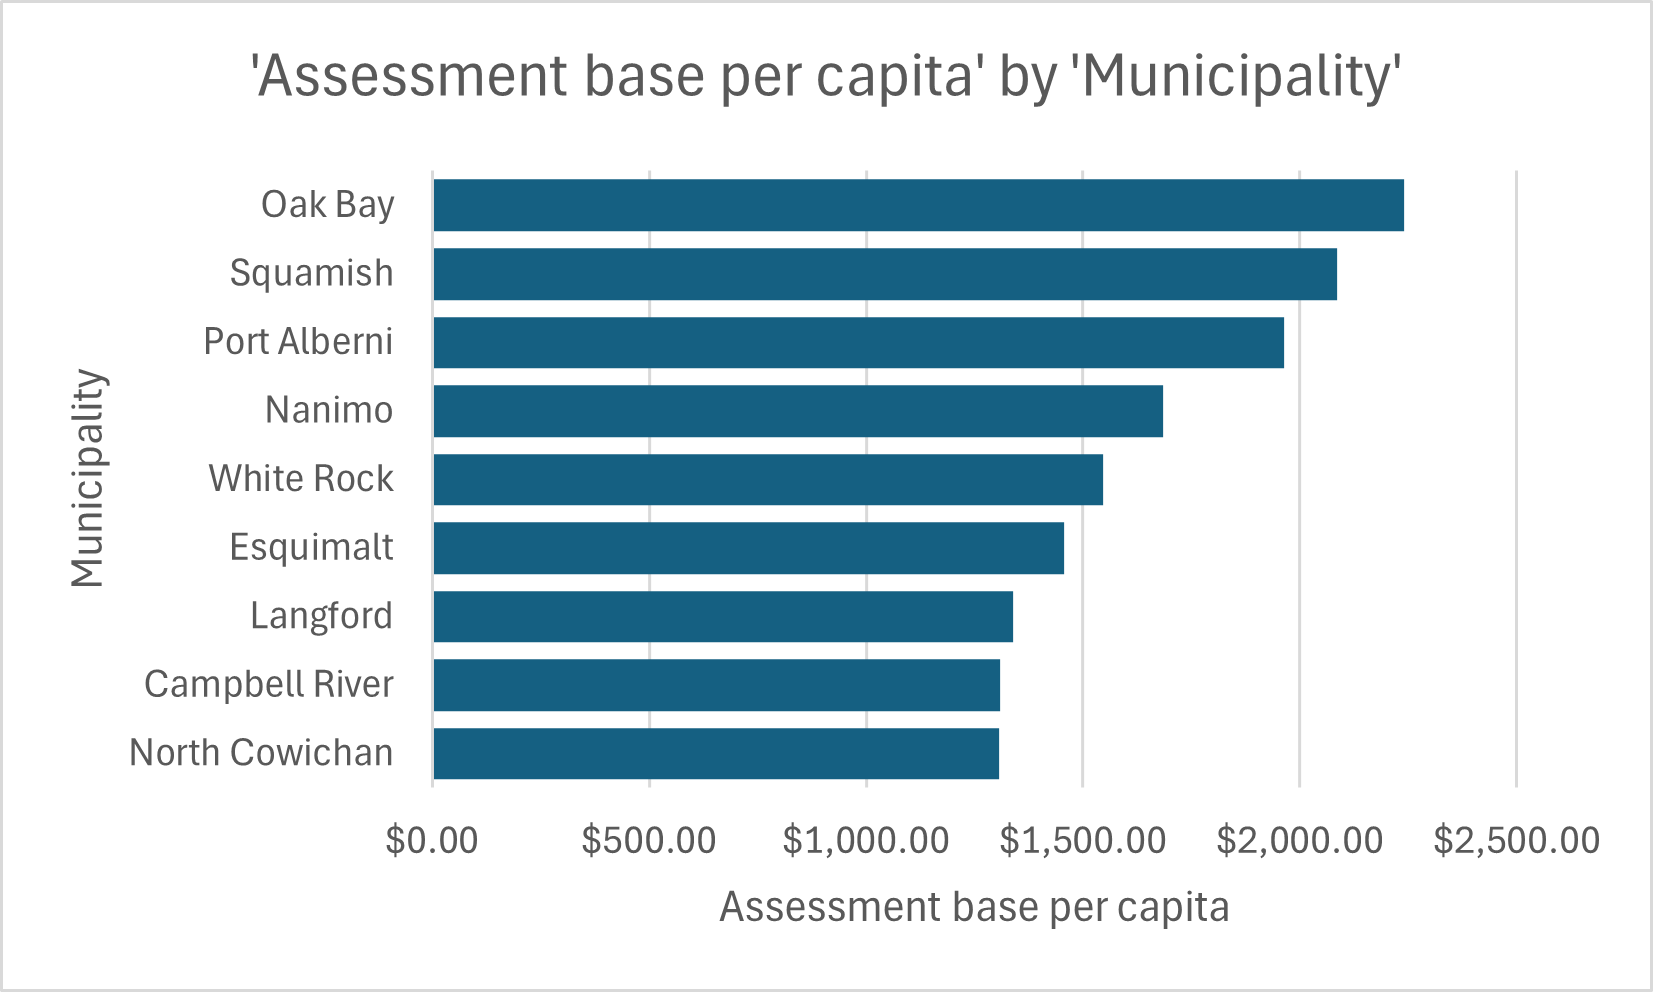
I believe the “taxes per capita graph” needed an “assessment base” per capita graph for comparison
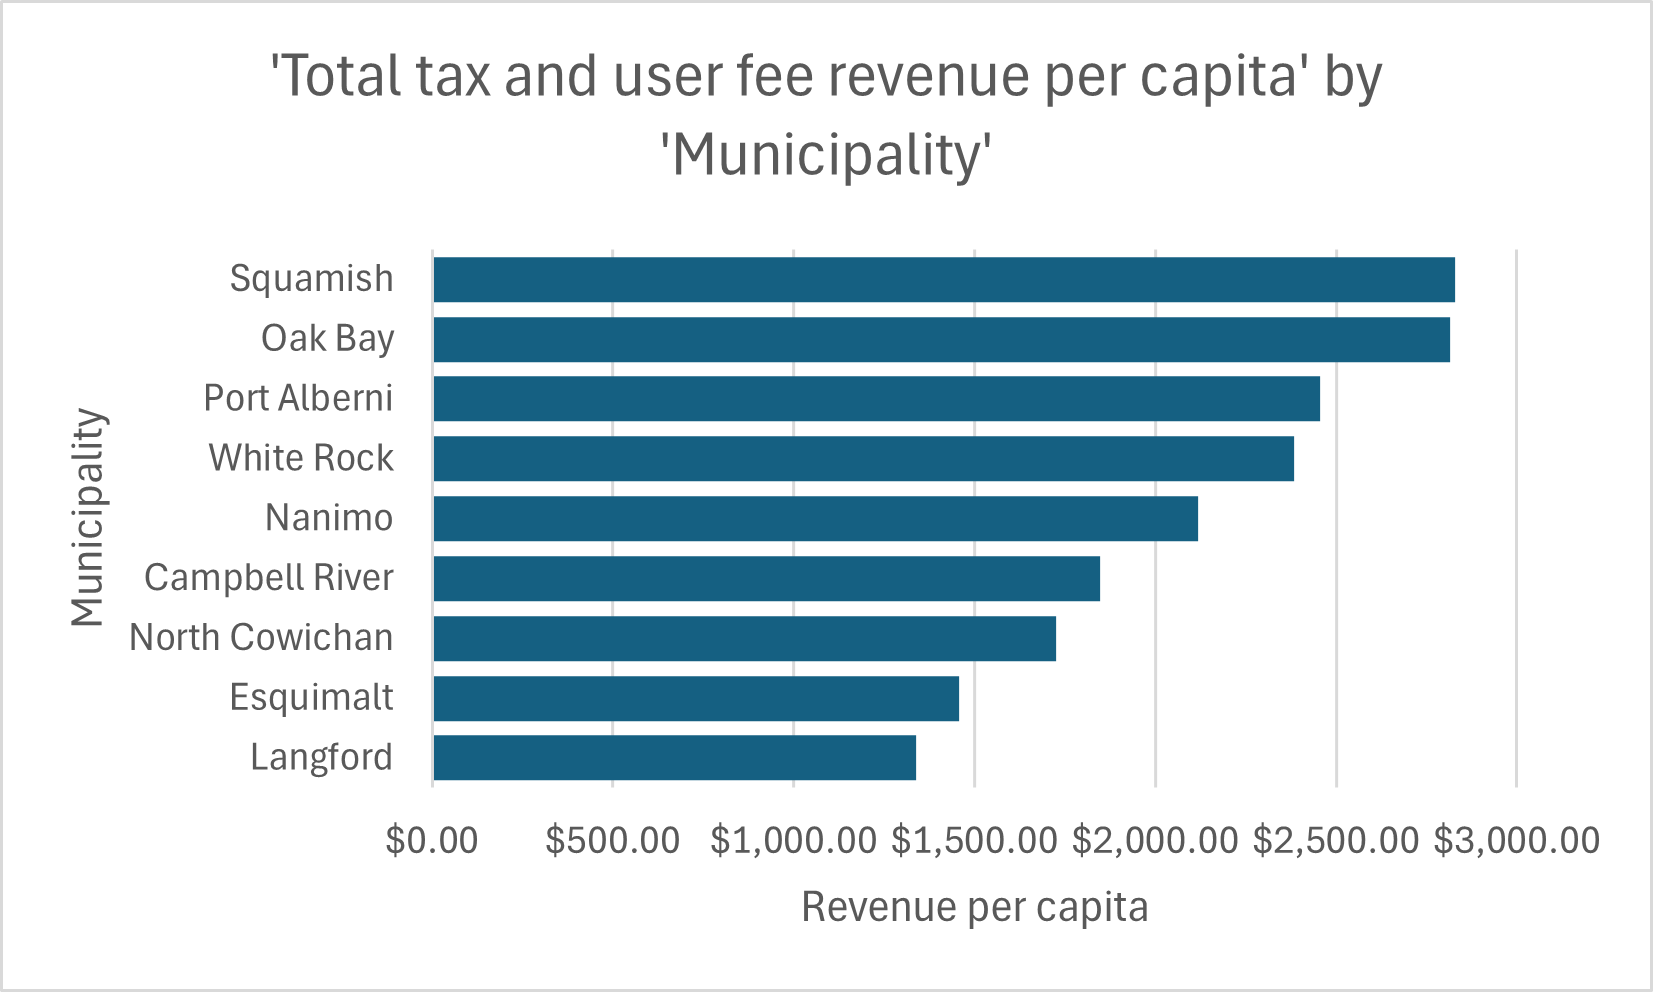
This table includes taxes, parcel taxes, and user fees as “total revenue” per capita to provide additional context
I found it interesting to compile these additional metrics, particularly the consideration of “municipal area” and “assessment base” because without these mitigating factors, looking just at taxes and tax revenue, tells an incomplete story. This additional data also allowed me to illustrate how, even though North Cowichan has a relative low assessment base consideration our area, we are already charging slightly higher taxes. Here is a table that shows assessment base by square km:
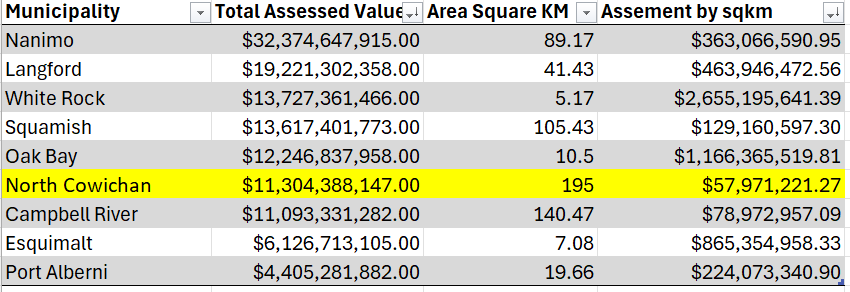
Distribution of assessable property across the boundaries of North Cowichan should be considered.