Why Local Government Matters
Municipal government in Canada is a level of government, however they are also created by the province which means they are subject to the legislative whims of the provincial government. This means that in our ever increasingly complex world, municipal leaders are responding by taking ownership of more and more issues as they become increasingly visible at the municipal level.
But their funding sources are not keeping pace. An argument can be made though, that in a world of ever increasing assessment values, the tax revenue portion of the municipal budget has at least, rightly or wrongly, continued to grow.
BC Assessment has a page about Property Taxes which includes this image:
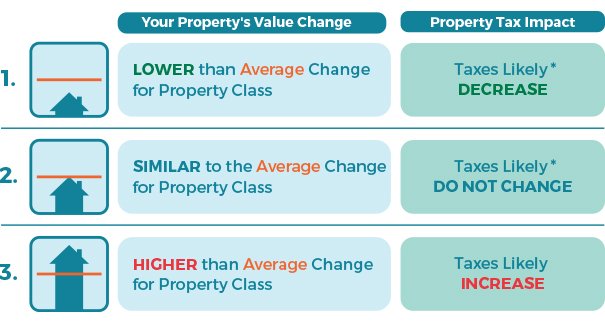
Does your experience as a taxpayer match this graphic from BC Assessment?
According to the 2015 Annual Report from North Cowichan, they took in $30,944,355 in taxation revenues. This revenue source then grew to $45,512,849 by the end of the 2024 fiscal year according to the 2024 Annual Report. Of course our assessment base has grown somewhat in this time based on new construction, but the changes in revenues brought in by the municipality is most likely attributed to growth of the assessed values of our property base.
As shown in this table from the same 2024 Annual report, is a breakdown on how North Cowichan spends money across its departments:
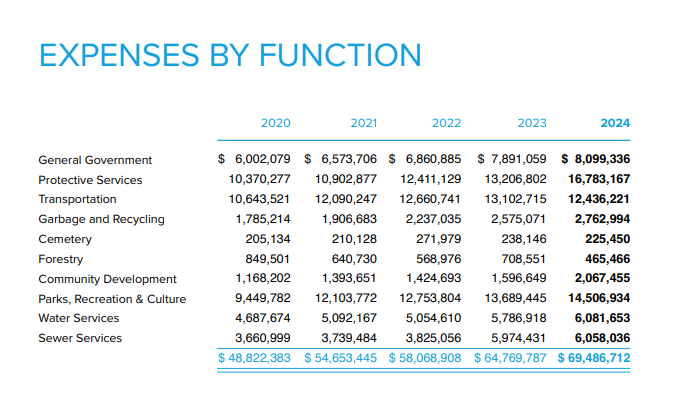
According to this chart:
General Government services accounted for 12% of the budget in 2020 and 11.6% of the budget in 2024
Protective services accounted for 21% of the budget in 2020 and 24% of the budget in 2024
Transportation services accounted for 21.8% of the budget in 2020 and 18% of the budget in 2024
Garbage and Recycling services accounted for 4% of the budget in 2020 and 4% of the budget in 2024
Cemetery services accounted for .4% of the budget in 2020 and .3% of the budget in 2024
Forestry services accounted for 1.7% of the budget in 2020 and .7% of the budget in 2024
Community Development services accounted for 2.4% of the budget in 2020 and 2.9% of the budget in 2024
Parks Recreation and Culture services accounted for 19% of the budget in 2020 and 20.8% of the budget in 2024
Water services accounted for 9.6% of the budget in 2020 and 8.7% of the budget in 2024
Sewer services accounted for 7.5% of the budget in 2020 and 8.7% of the budget in 2024
So this difference in trends is important because it is clear that Protective Services and Recreation services are really the only growth budgets. Costs of sewer services has also increased somewhat. In contrasts, monies spent on transportation services have decreased. What does this mean?
It is important to look at trends in funding because a reasonable person would assume that the proportion of overall budgets should change in response to community priorities. But how can North Cowichan do this comprehensively when, as noted from the Connect North Cowichan page, 2022 was the last year that a public satisfaction survey has been conducted.
I’m thinking it would be easy to create a public survey for people across North Cowichan to respond to on satisfaction/awareness of municipal services from North Cowichan. What do you think?